


Python Pandas Programs
- Python Pandas | How to create a MultiIndex with names of each of the index levels?
- Python Pandas | How to get the levels in MultiIndex?
- Python Pandas | How to get the name of levels in MultiIndex?
- Python Pandas | Set levels on a MultiIndex
- Python Pandas | Swap levels of a MultiIndex
- Python Pandas | Rearrange levels using level name in MultiIndex
- Python Pandas | Return MultiIndex with multiple levels removed using the level names
- Python Pandas | Create a DataFrame with the levels of the MultiIndex as columns and substitute index level names
- Python Pandas | Adding new column to existing DataFrame by declaring a new list as a column
- Python Pandas | Adding new column to existing DataFrame by using DataFrame.insert()
- Python Pandas | Adding new column to existing DataFrame by using Dataframe.assign()
- Python Pandas | Adding new column to existing DataFrame by using a dictionary
- Delete a column from a Pandas DataFrame
- How to rename columns in Pandas DataFrame?
- How to select rows from a DataFrame based on column values using loc property?
- How to change the order of DataFrame columns?
- How to get a list from Pandas DataFrame column headers?
- How to get the number of rows in DataFrame?
- How to count the NaN values in a column in Pandas DataFrame?
- Set value for particular cell in Pandas DataFrame using index
- How to Convert Index to Column in Pandas Dataframe?
- Creating an empty Pandas DataFrame, then filling it?
- Combine two columns of text in Pandas DataFrame
- Deleting DataFrame row in Pandas based on column value
- Convert list of dictionaries to a pandas DataFrame
- How to pretty-print an entire Pandas DataFrame?
- Writing a pandas DataFrame to CSV file
- Difference between loc() and iloc() in Pandas DataFrame
- How to widen output display to see more columns in Pandas DataFrame?
- How to Use \'NOT IN\' Filter in Pandas?
- Import multiple csv files into pandas and concatenate into one DataFrame
- How to avoid Pandas creating an index in a saved CSV?
- How to convert pandas DataFrame to NumPy array?
- How to check if any value is NaN in a Pandas DataFrame?
- How to count the NaN values in a single column in pandas DataFrame?
- How to Replace NaN Values with Zeros in Pandas DataFrame?
- How to fix UnicodeDecodeError when reading CSV file in Pandas with Python?
- Constructing pandas DataFrame from values in variables gives \'ValueError: If using all scalar values, you must pass an index\'
- How to apply a function to two columns of Pandas DataFrame?
- Convert DataFrame column type from string to datetime
- Create Pandas DataFrame from a string
- How to add an empty column to a DataFrame?
- Pandas DataFrame - Get first row value of a given column
- Sorting columns in pandas DataFrame based on column name
- Count the frequency that a value occurs in a DataFrame column
- Python Pandas: Get index of rows which column matches certain value
- How to check whether a Pandas DataFrame is empty?
- How to group DataFrame rows into list in pandas groupby?
- How to filter pandas DataFrame by operator chaining?
- Python Pandas: Conditional creation of a series/DataFrame column
- Selecting/excluding sets of columns in pandas
- How to use pivot function in a pandas DataFrame?
- How to apply a function to a single column in pandas DataFrame?
- How to flatten a hierarchical index in columns?
- How to remap values in pandas using dictionaries?
- Pandas get rows which are NOT in other DataFrame
- How to perform pandas groupby() and sum()?
- Pandas read in table without headers
- Pandas: Drop a level from a multi-level column index
- Get column index from column name in Python pandas
- How to keep only date part when using pandas.to_datetime?
- How to extract month and year separately from datetime in pandas?
- How to replace NaN with blank/empty string?
- How to drop a list of rows from Pandas DataFrame?
- How to select DataFrame rows between two dates?
- How to drop infinite values from DataFrames in Pandas?
- How to add a column to DataFrame with constant value?
- Split (explode) pandas DataFrame string entry to separate rows
- How to select with complex criteria from pandas DataFrame?
- How to count unique values per groups with Pandas?
- How to convert floats to ints in Pandas?
- How to insert a given column at a specific position in a Pandas DataFrame?
- How to update a DataFrame in pandas while iterating row by row?
- How to take column slices of DataFrame in pandas?
- How to select rows with one or more nulls from a Pandas DataFrame without listing columns explicitly?
- How to convert column value to string in pandas DataFrame?
- How to find the installed pandas version?
- How to merge two DataFrames by index?
- How to obtain the element-wise logical NOT of a Pandas Series?
- How to split a DataFrame string column into two columns?
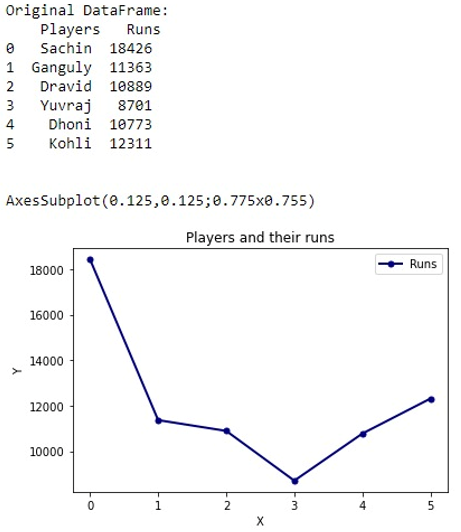
- How to add x and y labels to a pandas plot?
- How to find row where values for column is maximal in a Pandas DataFrame?
- How to apply Pandas function to column to create multiple new columns?
- How to convert Pandas DataFrame to list of Dictionaries?
- How to extract specific columns to new DataFrame?
- Why should we make a copy of a DataFrame in Pandas?
- How to get plot correlation matrix using Pandas?
- How to merge multiple DataFrames on columns?
- How to apply Pandas function to column to create multiple new columns?
- Python Pandas groupby sort within groups
- How to create an empty DataFrame with only column names?
- How to filter Pandas DataFrames on dates?
- What is the difference between join and merge in Pandas?
- How to determine whether a Pandas Column contains a particular value?
- How to get rid of \'Unnamed: 0\' column in a pandas DataFrame read in from CSV file?
- How to read a large CSV file with pandas?
- Label encoding across multiple columns in scikit-learn
- How to read text files with Python Pandas?
- What is the difference between join and merge in Pandas?
 Python programming
Let us understand with the help of an example.
Output:
need an explanation for this answer? contact us directly to get an explanation for this answer