


-1
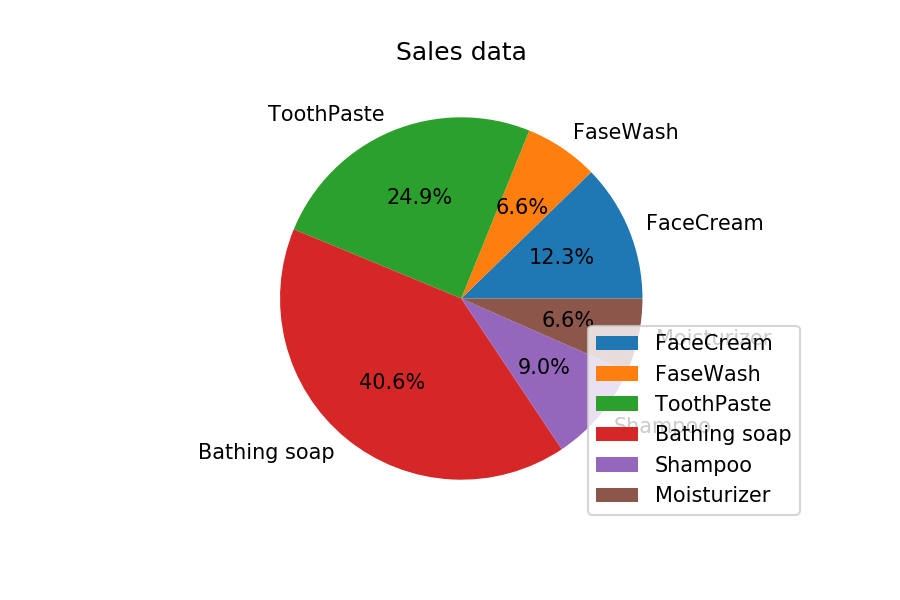
Calculate total sale data for last year for each product and show it using a Pie chart
Note: In Pie chart display Number of units sold per year for each product in percentage.
The Pie chart should look like this.
 Python programming