0
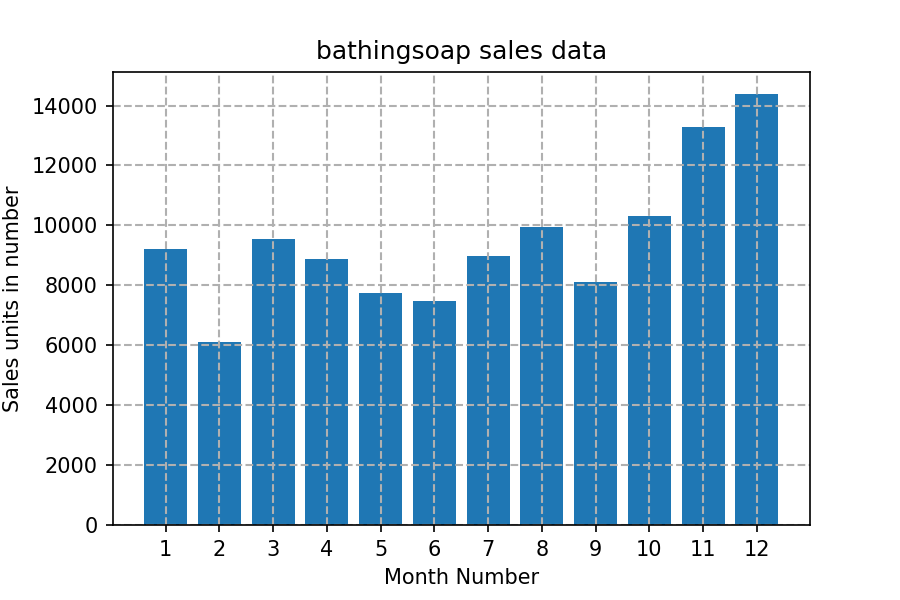
Read sales data of bathing soap of all months and show it using a bar chart. Save this plot to your hard disk
The bar chart should look like this.


belongs to collection: Python Matplotlib Exercises
The bar chart should look like this.
total answers (1)
 Python programming