


0
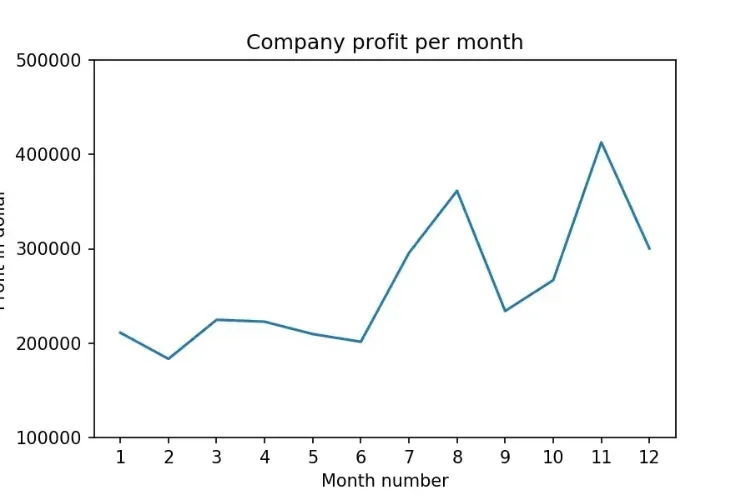
Read Total profit of all months and show it using a line plot
Total profit data provided for each month. Generated line plot must include the following properties: –
- X label name = Month Number
- Y label name = Total profit
The line plot graph should look like this.
 Python programming