Modules to be used:
nltk, collections, string and matplotlib modules.
nltk Module
The full form of nltk is "Natural Language Tool Kit". It is a module written in Python which works on the human language like what are the sentiments and emotions attached to it.
How can we Download it?
General Way:
pip install nltk

Pycharm Users:
Go to the project interpreter and install it.
Now after downloading this module, it does not mean that we can use its every package, for this we have to download its every package in this way,
NLTK Downloader
---------------------------------------------------------------------------
    d) Download   l) List    u) Update   c) Config   h) Help   q) Quit
---------------------------------------------------------------------------

Downloader>
Write d as we have to download the packages of nltk in it.
After this:

Download which package (l=list; x=cancel)?
  Identifier>

Write all in this ass we have to Download all packages of nltk
in our system,and after pressing enter this will take some time
as it is big file.

Note: You must have a good internet connection while
you are downloading this files.

This is all about nltk.
Collections Module:
collections is an inbuilt python module that provides us various functions like the counter in which you just give our list and it will return us a dictionary with the count of the elements.
matplotlib Module:
matplotlib is a python library that will help us to plot graphs and all. In this, we will use this library to plot the emotions and sentiments graph.
How we will find the emotions and sentiments?
First of all, we will create a blank text file in which we will write or paste our speech (for which we have to find the emotions and sentiments) and we will read this file and tries to make each word a lower word(with the help of .lower() function) and now after this, we will remove the punctuations from the text and also remove the newline characters from the text and after this, we will make the text tokenize with the help of nltk module (Tokenize means splitting the text into the list (we can also do it with the help of .split() function but nltk will be faster than this) ), Now after tokenizing we will remove the stopwords (Stopwords means the words which have no emotion) with the help of nltk function and after that we will find the emotions and sentiments attached to the remaining words and will plot it with the help of matplotlib.
We will see the various functions of nltk,
The link to the emotions.txt file is: https://github.com/abhinav0606/SentimentAnalysisNLTK/blob/master/emotion.txt
Or, download here: emotion.txt
I have a taken the speech of Mark Zuckerberg which he gave at Harvard.
Let's see the code,
Output:
Counter({'happy': 5, 'hated': 2, 'entitled': 2, 'attached': 1,
'attracted': 1, 'alone': 1, 'free': 1, 'loved': 1})
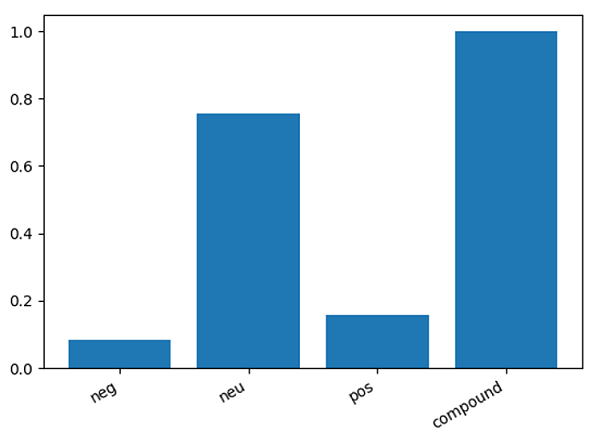
{'neg': 0.085, 'neu': 0.756, 'pos': 0.159, 'compound': 0.9996}
The plots are,
1) Emotions Graph:
2) Sentiments Graph:

need an explanation for this answer? contact us directly to get an explanation for this answer