Q:

Histogram using Pylab in Python

belongs to collection: Python miscellaneous programs

0

histogram is a plot which shows the distribution of values in a set of data. The values are sorted first and then divided into classes/group of equal size.

So, in this article, we are going to use hist() function to plot the histogram of the sum of randomly generated numbers.

The function pylab.hist(vals, bin = 10) produces a histogram with 10 equally sized groups and the frequency of result in those classes.

All Answers

need an explanation for this answer? contact us directly to get an explanation for this answer

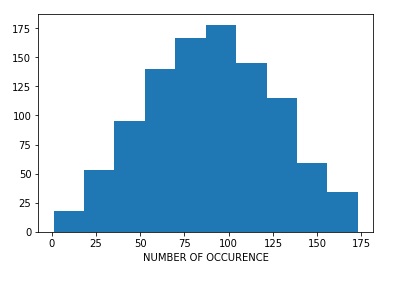
So here is the code:

import random
import pylab
val = []

for n in range(1004):
    x = random.choice(range(0,90))
    y = random.choice(range(0,90))
    val.append(x+y)
    
pylab.hist(val, bins = 10)
pylab.xlabel('NUMBER OF OCCURENCE')  

Output:

histogram in Python

need an explanation for this answer? contact us directly to get an explanation for this answer

total answers (1)

Python miscellaneous programs

This question belongs to these collections

Similar questions


need a help?


find thousands of online teachers now
Python program for single dice simulation... >>
<< Python program for plotting in same and different ...