Pandas is a special tool that allows us to perform complex manipulations of data effectively and efficiently. Inside pandas, we mostly deal with a dataset in the form of DataFrame. DataFrames are 2-dimensional data structures in pandas. DataFrames consist of rows, columns, and the data.
There is always some kind of similarity/difference between all the values of all the columns in pandas DataFrame. This similarity or difference is known as the correlation of values in a DataFrame. To find the correlation in pandas, we use pandas.DataFrame.corr() method in pandas.
pandas.DataFrame.corr() Method
This method is used to find the pair-wise correlation (similarities/differences) of the column values. An important point is if there is any null value present in any column, pandas.DataFrame.corr() automatically excludes it and also the non-numeric data is ignored.
Syntax:
DataFrame.corr(method='pearson', min_periods=1)
To work with pandas, we need to import pandas package first, below is the syntax:
import pandas as pd
Let us understand with the help of an example.
Output:
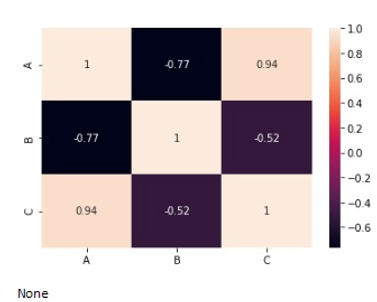
For visualising the correlation matrix, use the following code:
Output:

need an explanation for this answer? contact us directly to get an explanation for this answer