


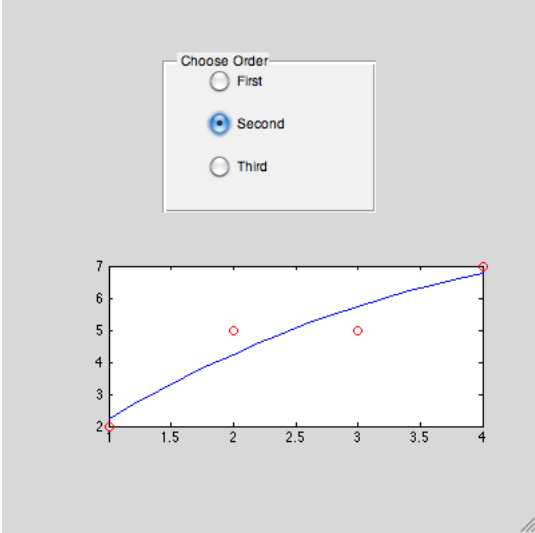
Write a GUI function that creates four random points. Radio buttons are used to choose the order of a polynomial to fit through the points. The points are plotted along with the chosen curve
belongs to book: MATLAB: A Practical Introduction to Programming and Problem Solving|Stormy Attaway|Fourth Edition| Chapter number:14| Question number:41.14
All Answers
total answers (1)
 Matlab
buttonGUI.m
function buttonGUI
f = figure('Visible', 'off','Position',...
[360, 500, 400,400]);
grouph = uibuttongroup('Parent',f,'Units','Normalized',...
'Position',[.3 .6 .4 .3], 'Title','Choose Order',...
'SelectionChangeFcn',@whattodo);
but1 = uicontrol(grouph,'Style','radiobutton',...
'String','First','Units','Normalized',...
'Position', [.2 .8 .4 .2]);
but2 = uicontrol(grouph, 'Style','radiobutton',...
'String','Second','Units','Normalized',...
'Position',[.2 .5 .4 .2]);
but3 = uicontrol(grouph, 'Style','radiobutton',...
'String','Third','Units','Normalized',...
'Position',[.2 .2 .4 .2]);
axhan = axes('Units','Normalized','Position',...
[.2,.2,.7,.3]);
x = 1:4;
y = randi(10, [1,4]);
lotx = 1: 0.2: 4;
set(grouph,'SelectedObject',[])
set(f,'Name','Exam GUI')
movegui(f,'center')
set(f,'Visible','on');
function whattodo(source, eventdata)
which = get(grouph,'SelectedObject');
if which == but1
coefs = polyfit(x,y,1);
elseif which == but2
coefs = polyfit(x,y,2);
else
coefs = polyfit(x,y,3);
end
curve = polyval(coefs,lotx);
plot(x,y,'ro',lotx,curve)
end
end
need an explanation for this answer? contact us directly to get an explanation for this answer