


0
Write a function plotexvar that will plot data points represented by x and y vectors which are passed as input arguments. If a third argument is passed, it is a line width for the plot, and if a fourth argument is also passed, it is a color. The plot title will include the total number of arguments passed to the function. Here is an example of calling the function and the resulting plot:
 x=-pi:pi/50:2*pi;
 y = sin(x);
plotexvar(x,y,12,'r')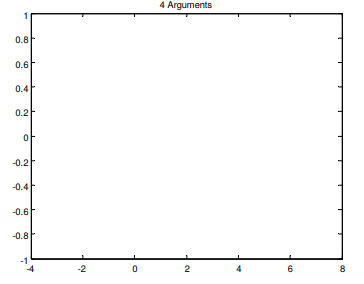
 Matlab
plotexvar.m
function plotexvar(x,y,varargin)
n = nargin;
han = plot(x,y);
title(sprintf('%d Arguments',n))
if n==3
set(han,'LineWidth',varargin{1})
elseif n==4
set(han,'LineWidth',varargin{1},...
'Color',varargin{2})
end
need an explanation for this answer? contact us directly to get an explanation for this answer