


A file called avehighs.dat stores for three locations the average
high temperatures for each month for a year (rounded to integers).
There are three lines in the file; each stores the location number
followed by the 12 temperatures (this format may be assumed). For
example, the file might store:
432 33 37 42 45 53 72 82 79 66 55 46 41
777 29 33 41 46 52 66 77 88 68 55 48 39
567 55 62 68 72 75 79 83 89 85 80 77 65
Write a script that will read these data in and plot the temperatures for
the three locations separately in one Figure Window. A for loop must
be used to accomplish this. For example, if the data are as shown in
the previous data block, the Figure Window would appear. The axis
labels and titles should be as shown.
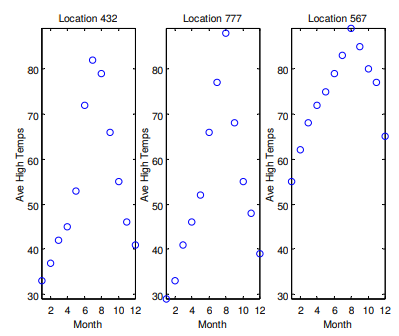
Figure Subplot to display data from file using a for loop If you have version R2016a or later, write the script as a live script.
 Matlab
Ch7Ex35.m
% Use subplot to plot temperature data from
% 3 locations
load avehighs.dat
for i = 1:3
loc = avehighs(i,1);
temps = avehighs(i,2:13);
subplot(1,3,i)
plot(1:12,temps,'bo')
title(sprintf('Location %d',loc))
xlabel('Month')
ylabel('Ave High Temps')
mintemp = min(min(avehighs(1:3,2:13)));
maxtemp = max(max(avehighs(1:3,2:13)));
axis([1 12 mintemp maxtemp])
end
need an explanation for this answer? contact us directly to get an explanation for this answer