


0
Figures A and B given below depict therelationship between transport rates (in Y-axis, inarbitrary units) and concentration gradients (in X-axis, in arbitrary units) of two substances A and Brespectively.
Which of the following statements iscorrect?
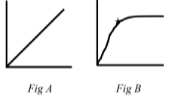
- B is transported by facilitated diffusion
- Transport of B is ATP dependent
- There is a ‘transport maximum’ for B
- Substance A would move in one direction only
 Medicine
C. There is a ‘transport maximum’ for B
need an explanation for this answer? contact us directly to get an explanation for this answer