


0
Figure 12.10 shows some relationships between lung volume (increasing upward) and oesophageal pressure (increasing to the right) during normal tidal breathing. In this diagram:
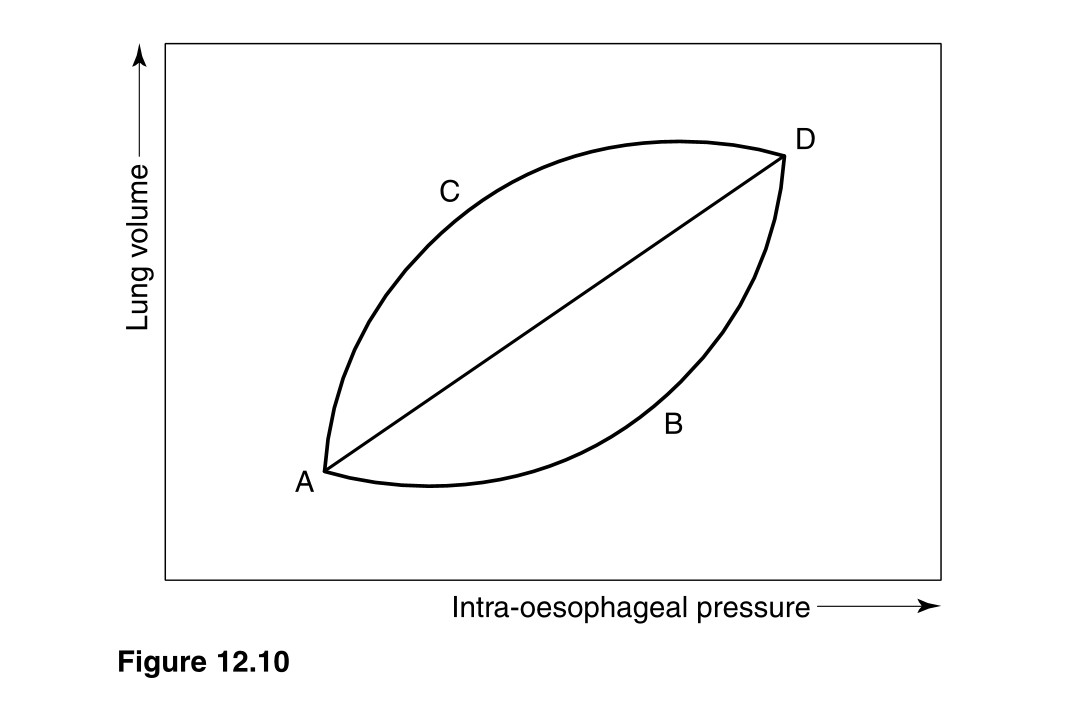
- The intra-oesophageal pressure is equal to atmospheric pressure at point A.
- The changes during the respiratory cycle follow the path ABDC.
- The slope of the line AD increases when lung compliance increases.
- The width of the loop CB increases when airway resistance increases.
- AD increases in length during exercise.
 Medicine
a. False Intra-oesophageal pressure is similar to intrapleural pressure which is negative with respect to atmospheric pressure at the beginning of a normal inspiration.
b. True In both inspiration (ABD) and expiration (DCA) volume changes lag pressure changes, thus the relationship is a hysteresis loop, rather than the straight line AD.
c. True Since compliance is volume change per unit pressure change.
d. True The greater the airway resistance, the more does air flow lag behind pressure changes, hence the greater the hysteresis.
e. True During exercise, both pressure changes and lung volume changes increase so that tidal volume increases.
need an explanation for this answer? contact us directly to get an explanation for this answer