


0
In Figure 12.8, which illustrates the handling of glucose by the kidney:
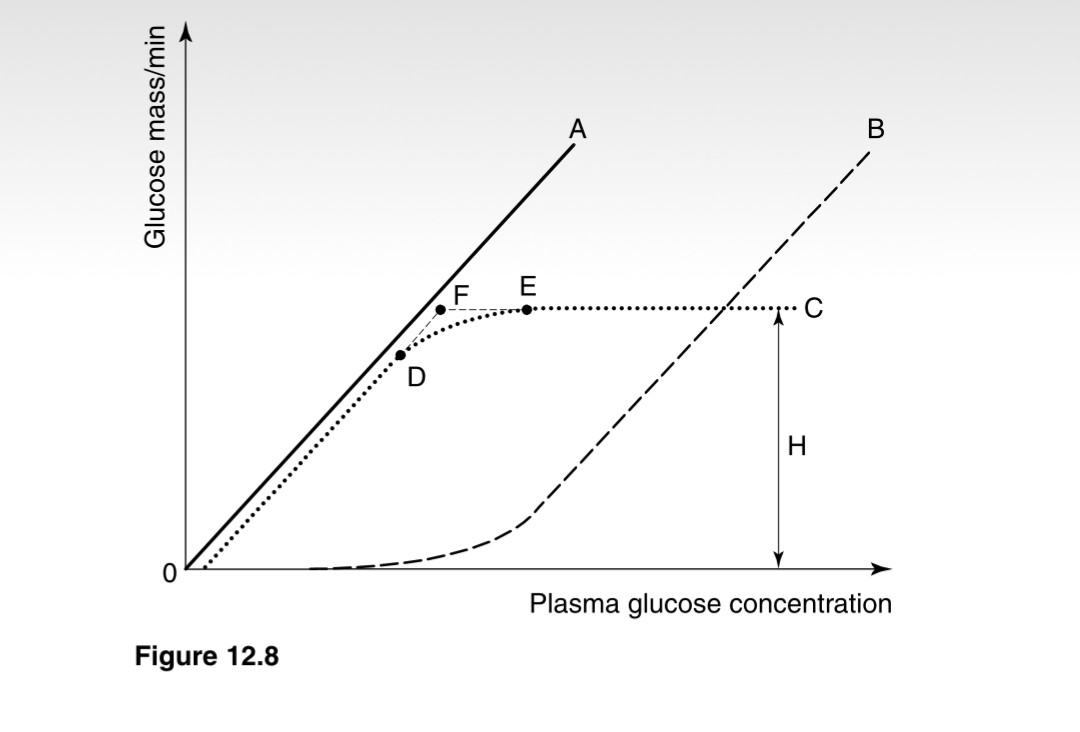
- Line A represents the rate of glucose filtration by the glomeruli.
- bLine B could represent the rate of absorption of glucose by the proximal convoluted tubules.
- Line C follows curve DE rather than angle DFE because different nephrons have differ-ent thresholds.
- H indicates the maximal reabsorbing capacity of the kidney for glucose.
- Renal poisons such as phlorhizin lower the value of H and shift line B to the right
 Medicine
a. True The rate of filtration is directly proportional to the plasma concentration.
b. False Line B represents the rate of excretion of glucose; line C represents glucose reab-sorbed; at low glucose concentrations absorption increases with the concentration and is complete; above these levels, EC, the maximal amount of glucose is absorbed and the rest excreted.
c. True Notice that glucose excretion gradually builds up at the same time due to loss of glucose by the less effective nephrons.
d. True The diagram shows features which are typical of a transport system with a limited maximal reabsorbing capacity.
e. False Though H is lowered, the reduction of Tm (glucose) results in glucose excretion at lower plasma glucose levels so the line B shifts to the left.
need an explanation for this answer? contact us directly to get an explanation for this answer