


0
In Figure 12.7, the line VXYW represents the threshold of hearing at various frequencies for a normal subject. The:
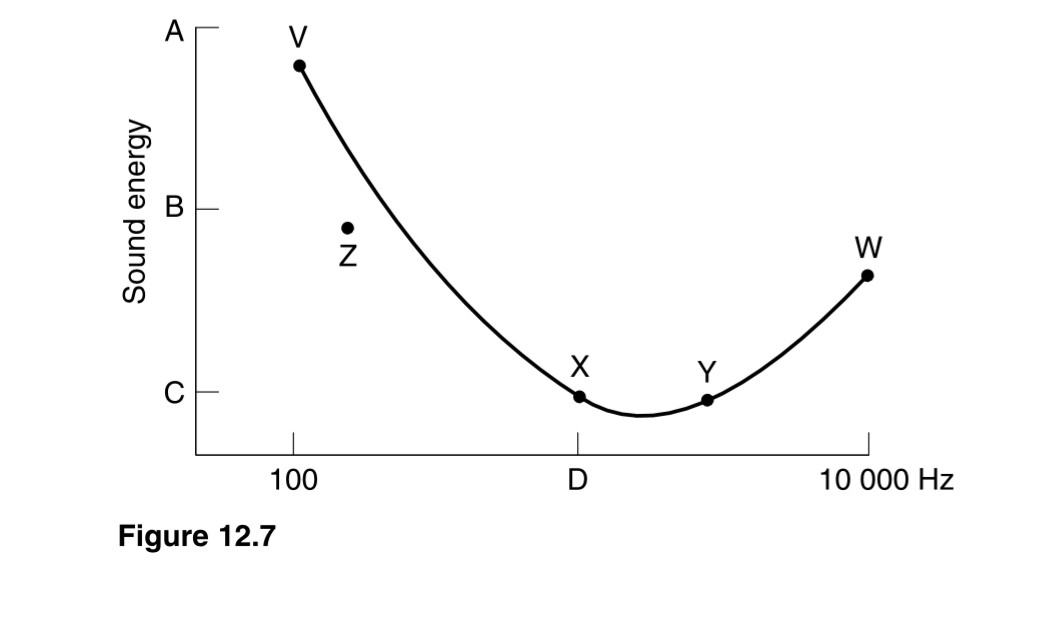
- Sound waves with the characteristics represented by point Z are audible to the subject.
- Interval AB on the ordinate represents 2.0 rather than 20 decibels.
- Point D on the abscissa corresponds to 5000 rather than 1000 Hz.
- Segment XY includes the frequencies most important in the auditory perception of speech.
- Curve is shifted downwards in the presence of background noise.
 Medicine
a. False Anything below the line is inaudible, having less energy than the threshold value for detection at a particular frequency (Hz).
b. False AB and BC both represent 20 decibels; thus sounds at the extremes of the hear-ing range need relatively high energy to be heard.
c. False It corresponds to 1000 Hz; the frequency (or pitch) scale is logarithmic.
d. True The ear is most sensitive to sounds in the range 1000–3000 Hz (XY), which includes the frequencies most important in distinguishing the different words in speech.
e. False It is shifted upwards since extraneous (masking) noise raises auditory threshold, that is the lowest energy level at which a sound of a particular frequency can just be detected.
need an explanation for this answer? contact us directly to get an explanation for this answer