


0
Figure 12.5 shows left ventricular (LV) function curves of the Frank–Starling type. If point X on curve B represents the conditions in the normal heart at rest then point:
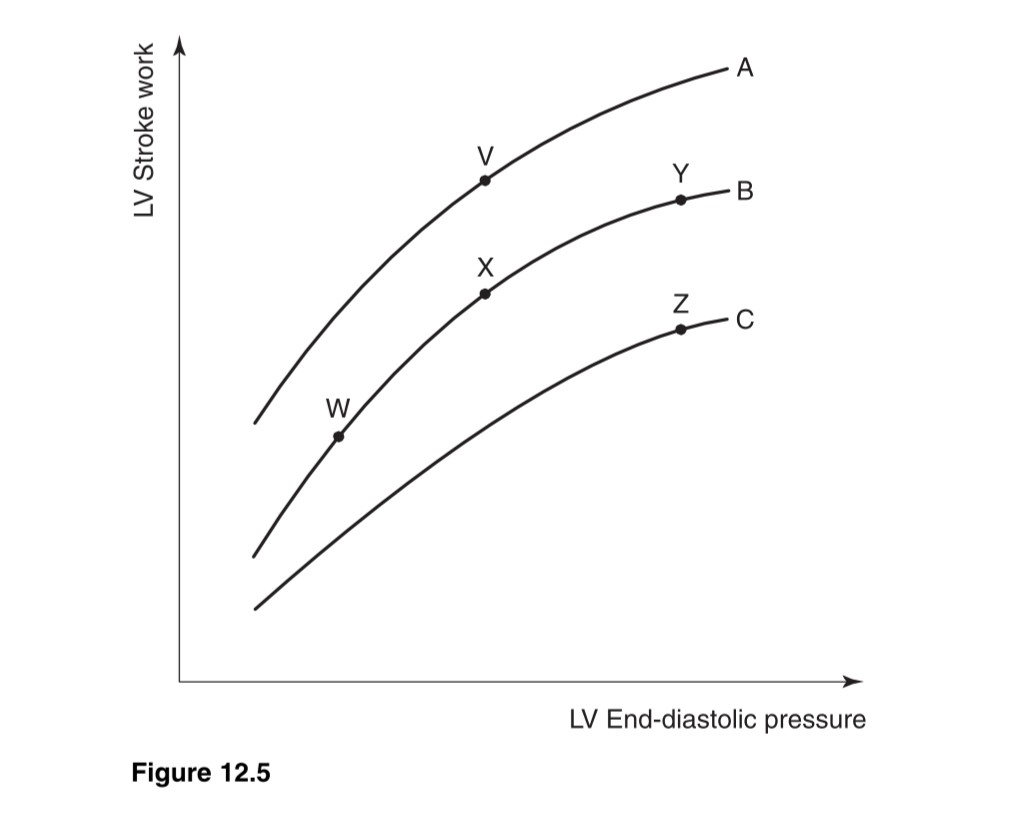
- Z might represent conditions in the failing ventricle at rest.
- Y might represent resting conditions in the ventricle in hypertension prior to failure.
- Y, rather than point V, might represent conditions in the ventricle after administration of a beta adrenoceptor agonist drug.
- V might represent conditions in a patient with aortic valve stenosis prior to failure.
- W might represent the conditions in hypovolaemic circulatory failure.
 Medicine
a. True Stroke work is subnormal; end-diastolic pressure increased.
b. False In early hypertension the left ventricle hypertrophies; stroke work is greater than normal at a given filling pressure (point V on curve A).
c. False Such a drug, e.g. isoproterenol (isoprenaline), mimics sympathetic stimulation and moves the ventricular curve upwards and to the left (to a point below V on curve A).
d. True Stroke work is considerably increased, end-diastolic pressure little changed.
e. True Ventricular function is normal but filling of the heart is inadequate.
need an explanation for this answer? contact us directly to get an explanation for this answer