


0
(Display a minimum spanning tree) Revise GraphView in Listing 28.6 to display a weighted graph and a minimum spanning tree for the graph in Figure 29.1, as shown in Figure 29.26. The edges in the MST are shown in red.

FIGURE 29.1 The graph models the distances among the cities.
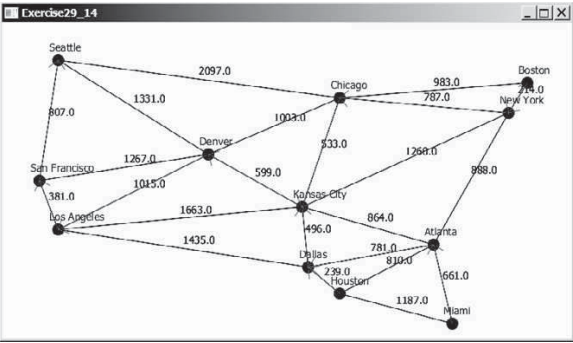
FIGURE 29.26 Programming Exercise 29.14 displays an MST.
 Java programming