Q:

Read Bathing soap facewash of all months and display it using the Subplot

0

Read Bathing soap facewash of all months and display it using the Subplot

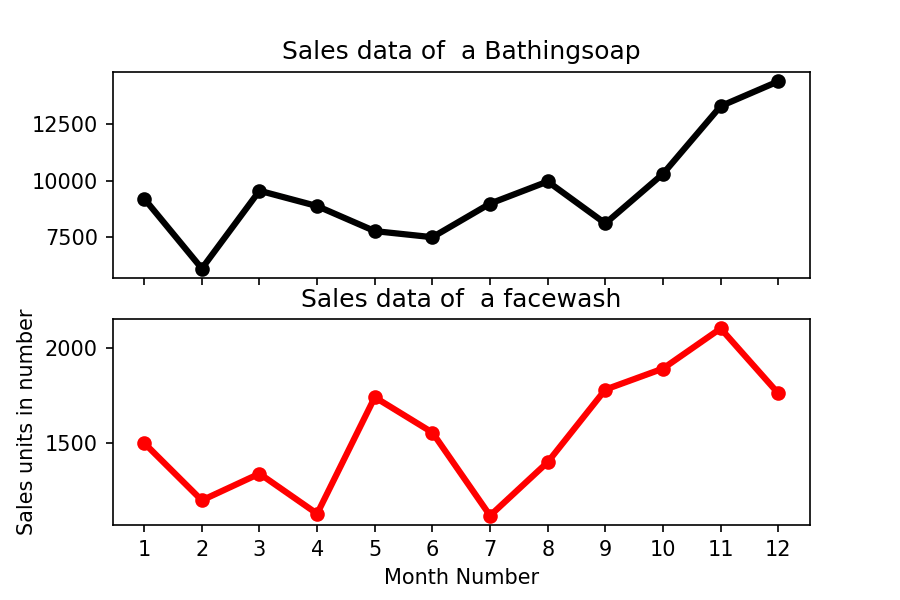
The Subplot should look like this.

Matplotlib Exercise 9: Read Bathing soap facewash of all months and display it using the Subplot

All Answers

need an explanation for this answer? contact us directly to get an explanation for this answer

import pandas as pd
import matplotlib.pyplot as plt  

df = pd.read_csv("D:\\Python\\Articles\\matplotlib\\sales_data.csv")
monthList  = df ['month_number'].tolist()
bathingsoap   = df ['bathingsoap'].tolist()
faceWashSalesData   = df ['facewash'].tolist()

f, axarr = plt.subplots(2, sharex=True)
axarr[0].plot(monthList, bathingsoap, label = 'Bathingsoap Sales Data', color='k', marker='o', linewidth=3)
axarr[0].set_title('Sales data of  a Bathingsoap')
axarr[1].plot(monthList, faceWashSalesData, label = 'Face Wash Sales Data', color='r', marker='o', linewidth=3)
axarr[1].set_title('Sales data of  a facewash')

plt.xticks(monthList)
plt.xlabel('Month Number')
plt.ylabel('Sales units in number')
plt.show()

need an explanation for this answer? contact us directly to get an explanation for this answer

total answers (1)

This question belongs to these collections

Similar questions


need a help?


find thousands of online teachers now