A PHP Error was encountered

Severity: 8192

Message: str_replace(): Passing null to parameter #3 ($subject) of type array|string is deprecated

Filename: libraries/Filtered_db.php

Line Number: 23

Read the total profit of each month and show it using the histogram to see the most common profit ranges
Q:

Read the total profit of each month and show it using the histogram to see the most common profit ranges

0

Read the total profit of each month and show it using the histogram to see the most common profit ranges

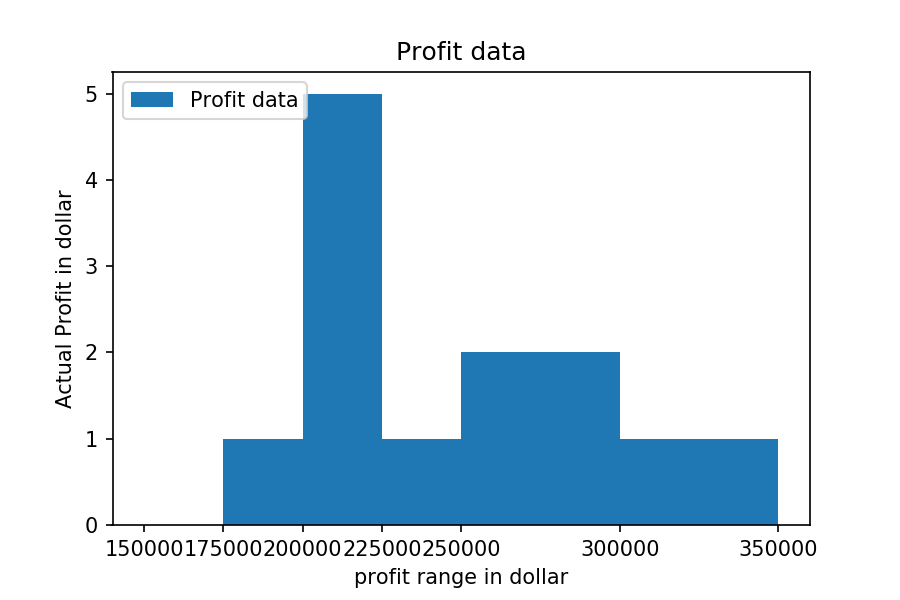
The histogram should look like this.

Matplotlib Exercise 7: Read the total profit of each month and show it using the histogram to see most common profit ranges

All Answers

need an explanation for this answer? contact us directly to get an explanation for this answer

import pandas as pd
import matplotlib.pyplot as plt  

df = pd.read_csv("D:\\Python\\Articles\\matplotlib\\sales_data.csv")
profitList = df ['total_profit'].tolist()
labels = ['low', 'average', 'Good', 'Best']
profit_range = [150000, 175000, 200000, 225000, 250000, 300000, 350000]
plt.hist(profitList, profit_range, label = 'Profit data')
plt.xlabel('profit range in dollar')
plt.ylabel('Actual Profit in dollar')
plt.legend(loc='upper left')
plt.xticks(profit_range)
plt.title('Profit data')
plt.show()

need an explanation for this answer? contact us directly to get an explanation for this answer

total answers (1)

This question belongs to these collections

Similar questions


need a help?


find thousands of online teachers now