


0
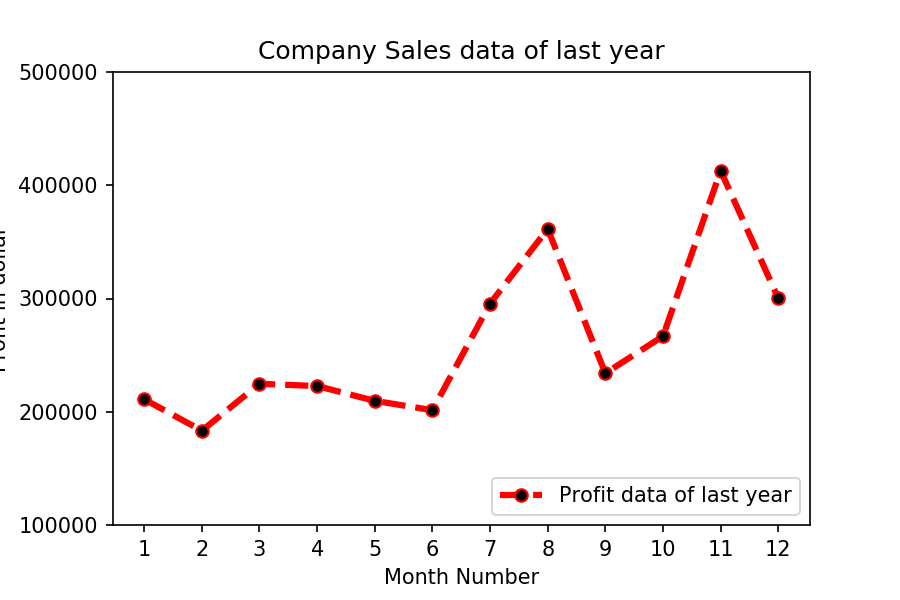
Get total profit of all months and show line plot with the following Style properties
Generated line plot must include following Style properties: –
- Line Style dotted and Line-color should be red
- Show legend at the lower right location.
- X label name = Month Number
- Y label name = Sold units number
- Add a circle marker.
- Line marker color as read
- Line width should be 3
The line plot graph should look like this.
 Python programming